About validating
When designing a chart it can be very useful to quickly check if it is 'valid', that is, if the number of stitches that are produced by each row matches the number needed to work the following row. Stitchmastery does this checking or 'validation' for you every time that a chart is edited. If finds a discrepancy then this is displayed in the Outline View. Note that the display in the Outline View can be toggled between an Overview and an expandable Outline. To see the expandable Outline, select the Outline icon on the Outline View toolbar  . To see the Overview, select the Overview icon on the Outline View toolbar
  .
.
All stitches have values for 'consumes' and 'produces'. The 'consumes' value is the number of stitches that need to be on the needle in order to work the stitch. The 'produces' value is the number of stitches that will be on the needle after this stitch is worked. To view these values for a stitch or number of stitches see Viewing and editing stitch libraries.
For each row, Stitchmastery calculates the number of stitches on the needles after the chart row is worked taking into account any explicit repeats that have been defined. This gives the total number of stitches 'produced' by that row and is the same as the stitch count that is optionally included in the written instruction output.
Also for each row, Stitchmastery calculates the number of stitches that need to be on the needles in order for the chart row to be worked. As before this takes into account any explicit repeats that have been defined. The result is the total number of stitches 'consumed' by that row.
Then, for each row, if the number of stitches 'produced' does not match the number of stitches 'consumed' by the following row, both chart rows are marked as having an error. It is possible that only one of the rows will have an actual error caused by too few or many increases / deceases or perhaps an incorrect decrease or increase has been used. However, Stitchmastery has no way of knowing exactly where the discrepancy lies so both rows are marked as in error. In addition, if any chart contains rows that have an error, the chart is also marked as being in error.
If wrong side rows are hidden on a chart, then wrong side rows will usually (see below) also be excluded from the written output and the expandable Outline. In this case, wrong side rows will be ignored when validating the chart and it will be only the 'consumes' and 'produces' values for right side rows that will be compared.
If wrong side rows are hidden on a chart and you still want the wrong side rows to be included in the generated written output and used for validating, then create a user Written stylesheet. Edit the stylesheet to unselect Ignore hidden rows. After you have created and edited the user Written stylesheet set it as the current Written stylesheet for the chart diagram file. See Creating a user stylesheet.
To view the validation results;-
-
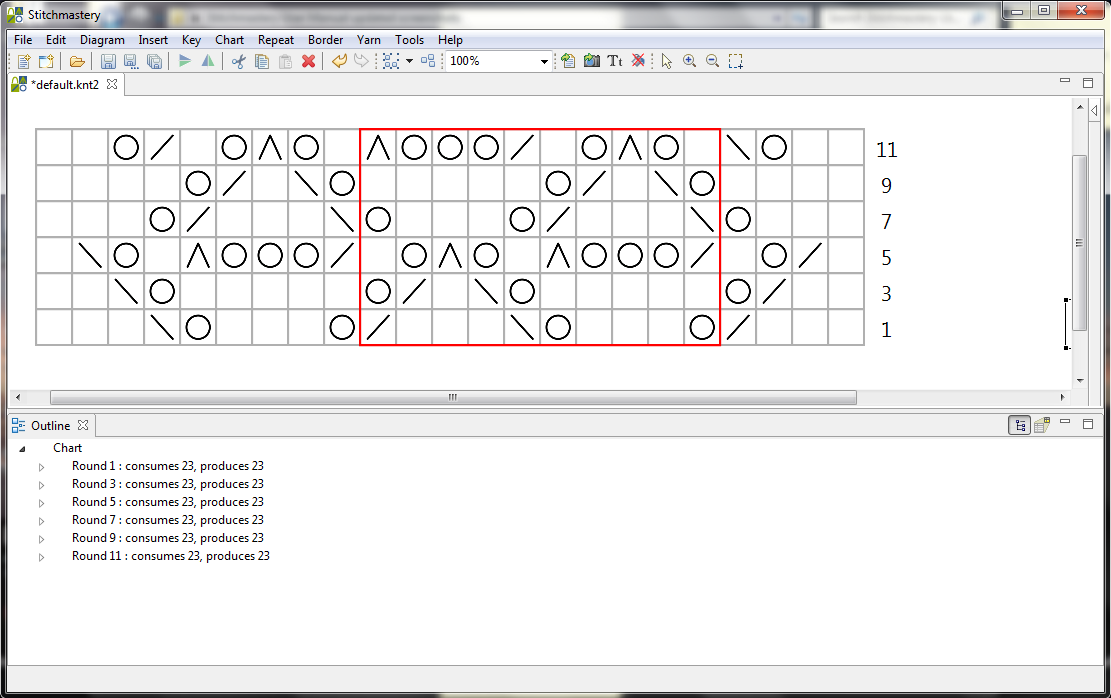
The validation results are displayed in the Outline View when the view is toggled to display the expandable Outline.
If the expandable Outline is not currently visible select the Outline icon on the Outline View toolbar
 (circled in orange in the screenshot below).
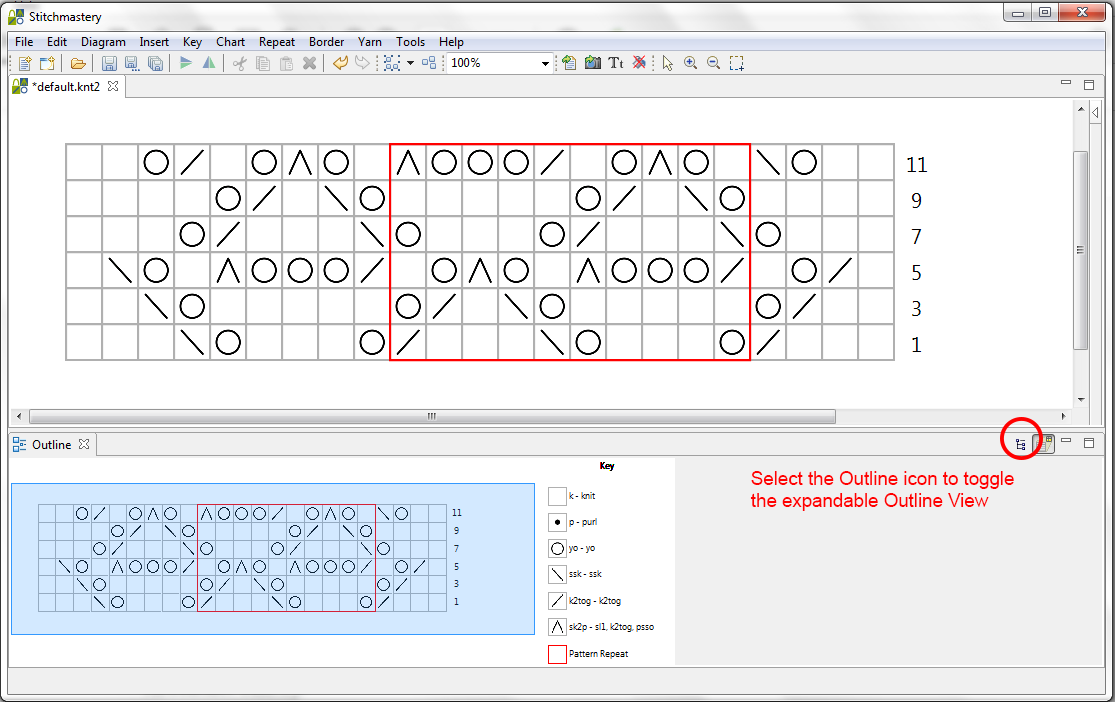
-
Initially the Outline is in a 'collapsed' state and only the chart title(s) (if any) will be displayed.
To view more detail, click on the right pointing triangle on the left hand side (circled in orange in the screenshot below).
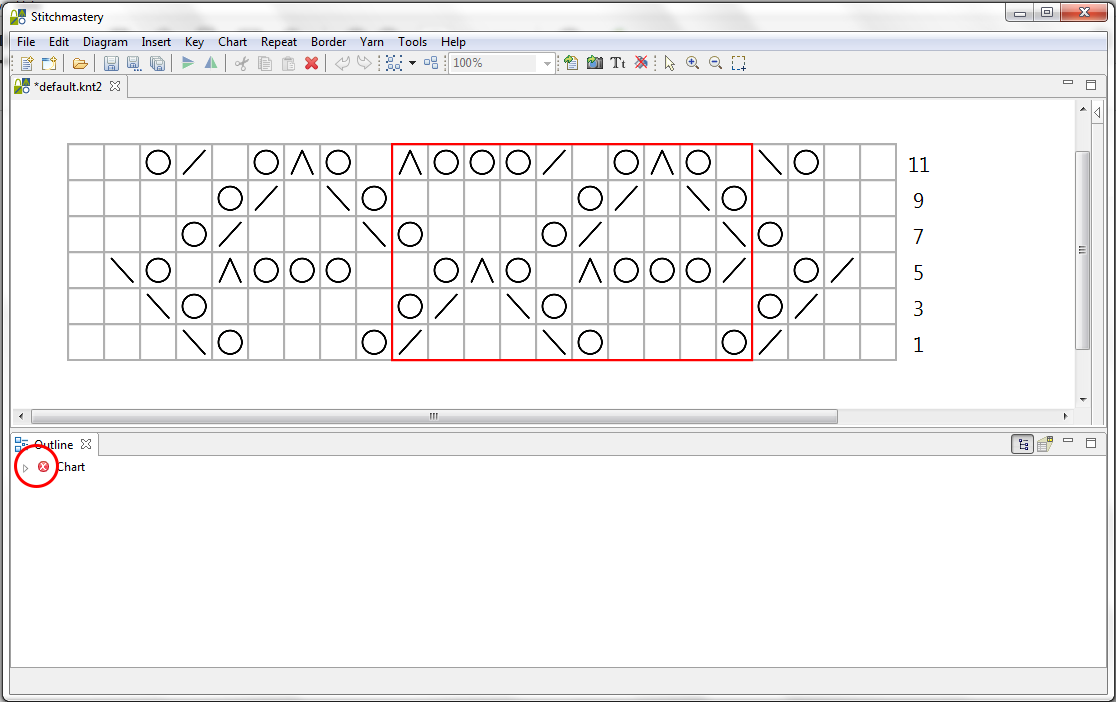
-
All of the rows in that chart will now be displayed together with information about the total 'consumes' and 'produces' values for each row.
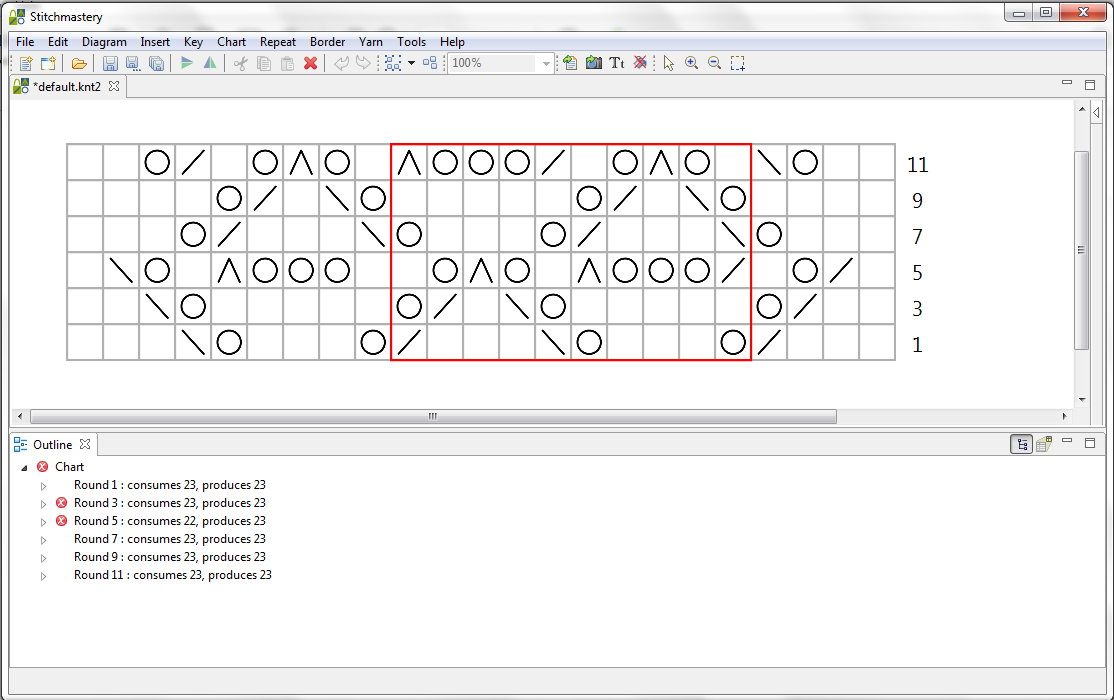
-
To view more detail for each row, click on the right pointing triangle on the left hand side of the row label.
-
All of the stitches and repeats in that row will now be displayed.
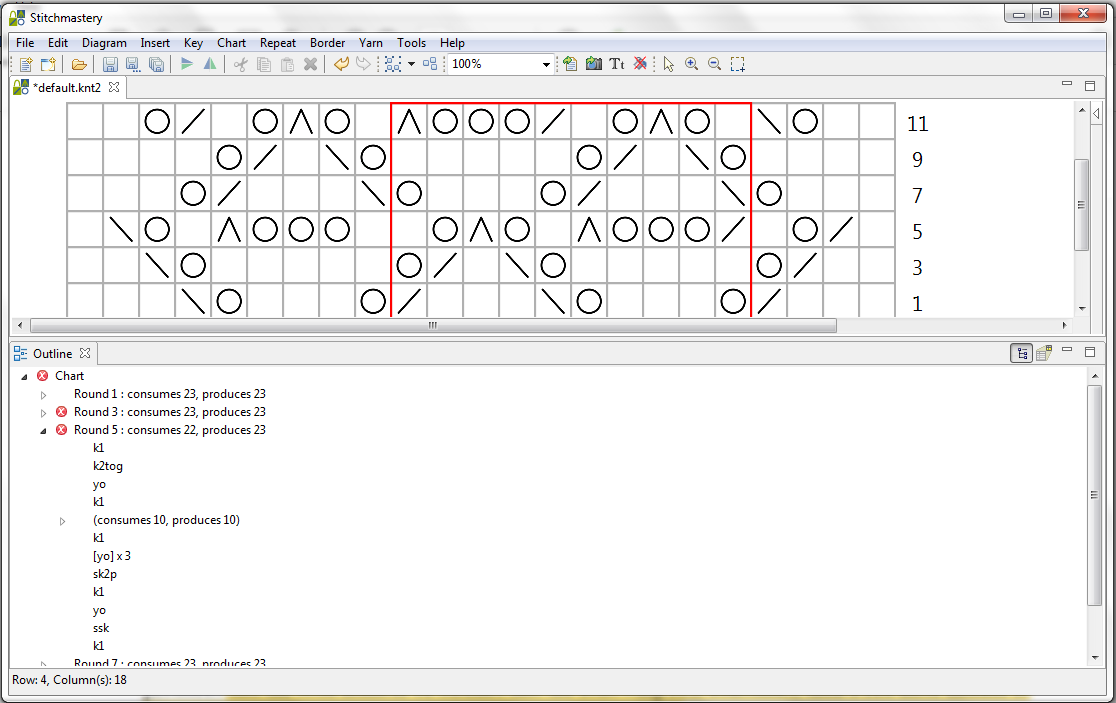
If an explicit repeat has been defined, the repeat will be displayed along with details of the number of stitches both consumed and produced by that repeat.
To view more detail for a repeat, click on the right pointing triangle on its left hand side.
-
If Stitchmastery has found a discrepancy between the total number of stitches that a row produces and the total number of stitches that the following row consumes, then a red error marker is displayed next to each of the rows as well as against the chart.
-
The information displayed can be used to check the chart to find and fix the cause of the error. Stitchmastery validates the chart after each edit so, as soon as it is fixed, the red error markers are removed.
Alternative sources of explanation:
Comments
0 comments
Please sign in to leave a comment.