When there are repeated stitches in a chart, annotations showing the number of such stitches can make a chart faster and easier to read. Stitchmastery has the ability to detect these stretches of repeated stitches and to automatically annotate them on the chart. It is relatively easy to get Annotations to be displayed and many options are also available to customise their appearance.
There are many situations where Annotations for repeated stitches can be very useful. To illustrate how powerful the Annotations feature of Stitchmastery is and how it is possible to customise them to display in very different ways in order to suit the chart, two examples are shown. These two examples are not exhaustive of the possible situations where Annotations can be used or of the different ways that they can be customised. Feel free to play with the different values for customising them to get the look that you want!
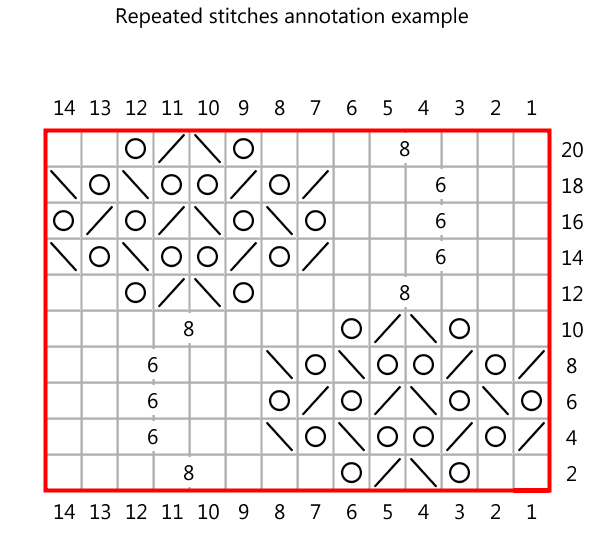
The first example is of a lace chart.

In this example annotations are displayed for all stretches that are 5 stitches or longer. The annotations have been centred both horizontally and vertically in the stretch of repeated stitches which means that the numbers are often in front of the grid lines. Hence the white background, rather than a transparent background, is used for the number so that it stands out against the grid lines.
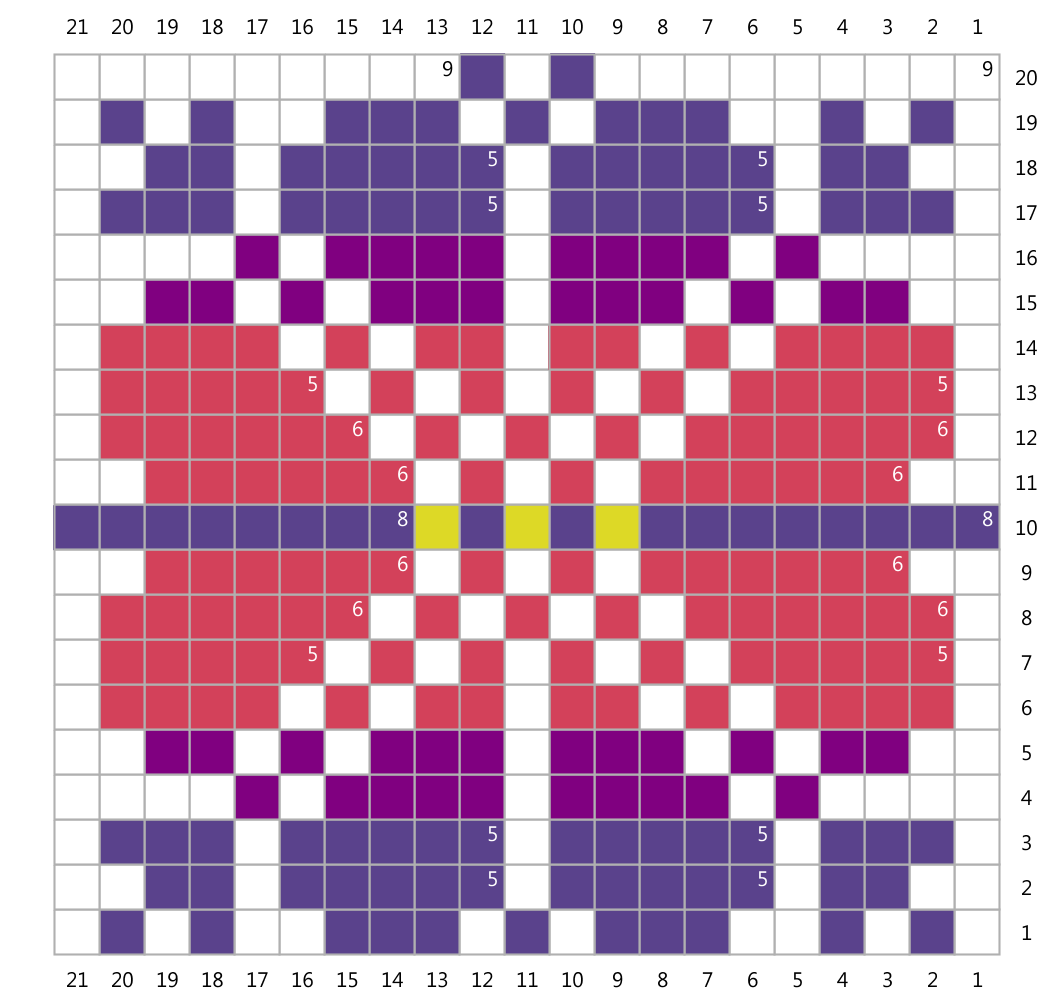
The second example is for a colourwork chart.

As before, annotations are displayed for all stretches that are 5 stitches or longer. Because the backgrounds of the cells are not white, the Number background transparent value has been selected. In order that the numbers are not then in front of the grid lines the horizontal position has been edited so that all the numbers are in the top right corner of the repeat stretch. In addition, to ensure that the number stands out against the coloured backgrounds, the Automatically contrasts with yarn colour value has been selected. In order for the latter to work, the Include colour in written instructions and for repeated stitches value has been selected in the Written tab of the Edit Diagram Properties dialog. See Editing Diagram Properties for more details.
Below are listed the different values that can be used to customise how Annotations are displayed.
-
In order to show annotations and be able to edit the annotations values, select Display Annotations.
-
The Minimum number of stitches defines the number of similar stitches that must be next to each other before an annotation is displayed. Any 'stretch' less than this number is not annotated. This number must be between 3 and 9.
-
Select Number background transparent to have the number drawn with a transparent background. If not selected, the number is drawn with a white background. A transparent background is useful for a colourwork chart, whilst a white background is best if the number is in front of symbols and grid lines.
-
If Automatically contrasts with yarn/colour is selected then, if the background colour is dark the number colour swaps to white. Note that this only works if Include colour in written instructions is also selected.
-
The font for the numbers can be selected.
-
There are four options for the horizontal positioning of the annotation number within the stretch of repeated stitches; Left, Right and Centre position in the number to the left, right or centre of the stretch respectively. Beginning places the number at the beginning of the stretch. That is, for right side rows and for charts worked in the round, the number is always on the right hand side, whilst it is on the left for wrong side rows.
-
The vertical position can be set to either Top, Bottom or Middle
-
Once the number's horizontal and vertical positions have been set, its exact location can be fine tuned by editing the Gap at sides and Gap at top/bottom values. However, these values have no effect if the number is centred.
There are two ways that values can be edited;-
-
Editing the values for each chart diagram file. The values for each individual file can be edited by using Diagram > Edit Diagram Properties. See Editing Diagram Properties for more details.
This is a good way to quickly change the values for an individual file and to experiment with different values. However, if you would like to have annotations on all or many of your chart diagram files, then you will save time by using the second option below.
-
Create a user Appearance stylesheet. If you find yourself editing the same values for more than one chart diagram file then it is worth your while setting up a stylesheet with those values and using it as the active stylesheet. See Creating a user stylesheet for details of how to create the user stylesheet.
Once a stylesheet has been created it still needs to be set as the 'active' Appearance stylesheet on a chart diagram file. The 'active' stylesheets can be selected when a chart diagram file is created. If a chart diagram file exists already and you want to change the 'active' Appearance stylesheet this can be done by using Diagram > Edit Diagram Properties.
Alternative sources of explanation:
Comments
0 comments
Please sign in to leave a comment.